Profiler (spyder-profiler plugin)
The profiler plugin for Spyder shows the time spent on each function/method during the execution of a program. The source code can be downloaded from github.
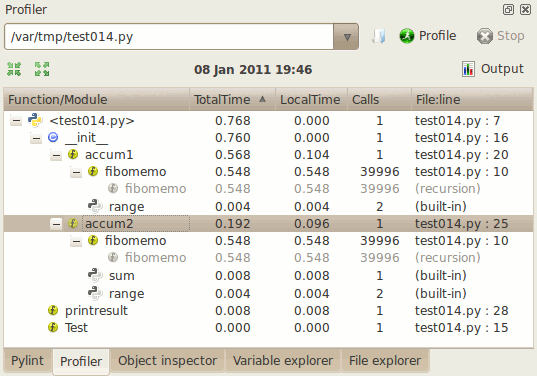
The tree shows the results calculated by python’s module ‘cProfile’. Recursive calls appear only once and in lighter color.
Note that the time and call values shown by this plugin are global to the execution of the program and not specific to a particular call. Because of this, some functions/methods may show longer times than their callers.
Features to add
- Redirect to the function definition in editor when clicking on a profiler item.
- Color rows/cells according to time spent.
- Add icon to first column according to entry type (function, module, ...).
- Features from other profilers (see below).
- Show the class associated with each method.
Issues and bugs
- The data on each row corresponds to the total time or number of calls for a function/method, not only the time/calls on that particular instance. For this reason, you may see nodes with longer times than their parents.
- The combobox is only used for selecting the file, it does not run the profiler (you need to press the Profile button).
- Profiling multithreaded programs has not been tested.
- The icons in the tree do not differentiate between functions and methods.